Be Data Literate Part I: How Aggregated Data Misleads Management
Add bookmark
09/05/2018

Editor's Note:
The term "disaggregating data" is well known in the fields of economics and statistics.
Quite frankly, we have become annoyed – indeed, angered – by the frequency with which overly aggregated data are/is used intentionally (or even unintentionally) by cable TV talk show hosts, politicians of all stripes, statistically ignorant guests, and others to sell what they call "statistical evidence" to justify their particular narrative.
H.G. Wells said more than 100 years ago: "Statistical thinking will one day be as necessary for efficient citizenship as the ability to read and write."
Understanding that "overly aggregated data" conceals important differences that could lead to faulty conclusions is not only a skill that every manager must master but every citizen must be made aware of.
Our purpose in this article is to discuss the importance of disaggregating data for management decision-making.
But – and this is a big but – to be able to evaluate claims made about crime statistics, gun control, illegal immigration, wage gap inequalities, and all the rest, a basic understanding of data disaggregation is now a must-do requirement.
For any manager looking to flex their leadership acumen, he or she must not only be able to read data, but have the ability to detect the forces that skew the reliability. Reliability refers to repeatability…that is, confirmed by other qualified investigators studying the problem.
Many journalists are not even aware of it. Neither is corporate America. National magazines deny its existence. And public service organizations think it’s a process by which to extend the shelf life of milk.
It is called homogeneity.
This may sound intimidating, but it’s not. Hang in there! It’s worth the effort. Understanding the basics of homogeneity may help you reach the next level of truly effective management.
Simply put, homogeneity of data refers to whether or not the total data set from which measurements were computed conceals important differences between or among what statisticians call "rational subgroups or just plain subgroups." (Trust us when we say this definition will make sense by the end of this article.)
Breaking Down Homogeneity
To understand homogeneity, you must first understand what the term "aggregation" means. Again, stay with it!
The degree of aggregation in data refers to the level of detail or refinement in data. A high level of aggregation conceals differences between and among subgroup categories.
In order to reach the correct state of "homogeneity" with respect to your data you must "disaggregate" your data in an appropriate fashion.
Memorize this. A high level of aggregation conceals differences between and among subgroup categories. Should we say it again? We should. It will soon make sense - guaranteed!
But just memorize it for now! Got it? If so, continue reading.
What's a Subgroup?
Let's start with a very simple example. Suppose someone in your office decides to calculate the average weight of all office employees.
Average weight is a measurement. The data collector makes no distinction between men and women.
He/she simply gets everybody's weight, adds up the total weight, and divides by the number of employees (total weight/total number of employees).
And the would-be data analyst proudly announces the average weight equals 160 pounds. You've likely already figured out what's wrong here.
In fancy (i.e., more technical) language, we would say the data set (men and women combined) is "overly-aggregated" with respect to the characteristic under study namely – weight of employees.
We have to subdivide the total data set into two relevant subgroups – men and women.
And that's what we do. Guess what happens? The average weight of all the women in your office equals 125 pounds; and the average weight of all the men equals 159 pounds.
The two subgroups (men and women) revealed a significant difference in weight. That would lead us to the conclusion the original data set (men and women combined) was non-homogeneous with respect to the characteristic under investigation: weight.
Why? Because the original data set concealed significant differences in two relevant subgroups – men and women.
A More Precise Definition of Homogeneity
If a group of items (or set of data) can be sub-classified on the basis of a pertinent characteristic other than the one under investigation into subgroups which yield significantly different values for the characteristic under investigation, then the group of items or total data is said to be non-homogeneous with respect to that characteristic.
The characteristic under investigation in the above example was weight of employees. The pertinent characteristic other than the one under investigation was gender.
By subdividing the total data set into male and female subgroups, we noted a significant difference in the weight of males versus females.
This leads us to the conclusion the original data set (males plus females) was non-homogeneous with respect to the characteristic under investigation (weight).
Take-home message: When we deal with overly-aggregated data we may be misguided in our conclusions because we inspect the data from an incorrect perspective.
The basic question is whether the result for the total group being studied (i.e., total data set) conceals important differences between and among relevant subgroups. If it does, chances are you will jump to the wrong conclusion.
A Caveat
A group/data set may be homogeneous with respect to one characteristic or measurement and at the same time not be homogeneous with respect to another.
The set of people reading this article may very well be homogeneous with respect to I. Q. but not homogeneous with respect to statistical training.
Another Simple Example
Is your data overly-aggregated?
Assume it is. You can never go wrong with this mindset.
Although most people are not aware of it, the key to finding the root cause of many problems is to “disaggregate” an aggregate number.
So how do you disaggregate data? First, find relevant sub-aggregates or subgroups. This requires thinking and knowledge of the particular situation.
The percentage of delayed flights for a given airline is an “aggregate number.” How would you subdivide "delayed flights" into relevant subgroups?
If delayed flights are subdivided into subgroups representing delayed flights at five airports, the resulting numbers represent "sub-aggregates" or "partitions." You, however, can call them subgroups. Your choice!
To repeat: The degree of aggregation in data refers to the level of detail or refinement in data. A high level of aggregation conceals differences between and among subgroup categories.
Most people realize “analysis of disaggregated data” may reveal important problems. For example, if the number of delayed flights increased in the aggregate, the number of delayed flights may have still have decreased in four out of the five airports.
One airport may account for the overall, that is, aggregate increases in delayed flights because of, say, extremely bad weather conditions or other assignable causes.
This aggregate increase in delayed flights conceals what’s really happening and could prevent remedial action.
And Another Simple Example
Many years ago, one of our editors read a news story citing the significant difference between the points men and women scored on mathematical aptitude tests in several university-sponsored examinations (not related to SAT scores).
Recreating this long-ago story, the average for men was reported at 560 points and the average for women was 521.
A difference of this magnitude had all sorts of implications (or so went the rhetoric) concerning the teaching of quantitatively oriented courses.
Radically different male versus female performances, however, had not been observed in these courses, and the data was inspected further.
Examination of the scores for men and women within various professional schools within the universities supplied the rather simple explanation.
Mathematical aptitude scores in the engineering schools at the universities studied were high for both sexes; but (at the time) there were very few women enrolled in the engineering schools.
The schools of nursing, on the other hand, were almost exclusively composed of women, and most students in the nursing schools recorded significantly lower scores in the mathematical aptitude examinations given.
The appropriate data are given in Table I, and seems to indicate males and females within a given professional school had very similar averages.
 What superficially appears to be a difference associated with gender became, on closer examination, a difference associated with professional school.
Within a given professional school men and women are "homogeneous" with respect to mathematical aptitude.
Measuring Patient Outcomes: The Potential Effects of Lurking Subgroups
The above examples illustrate the effect of subgroups that can invalidate a presented measurement. We now continue with a more practical example taken from today's news headlines.
In an attempt to help people make informed decisions about health care options, the government releases data about patient outcomes for a large number of hospitals.
Further, hospitals, in many instances, are financially rewarded on the basis of "patient outcomes." Many learned articles have been published about the benefits and dangers of this relatively new happening.
To think through the appropriate measurement (s) for patient outcomes is in itself a policy decision, and therefore highly risky.
Measurement directs effort and vision; measurement determines where efforts should be spent.
Improving patient outcome measurements has become the raison d'être for an increasing number of hospitals in, large part, because of the associated financial rewards accruing to those with improved scores.
David S. Moore & George P. McCabe's outstanding applied data analysis textbook, Introduction to the Practice of Statistics (2007) provides a hypothetical example of what can go wrong with patient outcome measurements – and potentially produce an unexpected/unwanted result.
You are interested in comparing Hospital A and Hospital B, which serve your community. Here are the data on the survival of patients after a specific kind of surgery in these two hospitals.
All patients undergoing surgery in a recent time period are included; 'survived' means that the patient lived at least six weeks following surgery.

The evidence seems clear: Hospital A loses 3% (63/2100) of its surgery patients, whereas Hospital B loses only 2% (16/800).
You should choose Hospital B (2% mortality) if you need surgery. At least, that's what the aggregated data reveals.
But you now know a high level of aggregation conceals differences between and among subgroup categories. Unfortunately, the very patients the government wants to protect are unaware of this statistical truism.
Subclassifying by Patient Condition: Disaggregating Patient Outcome Data
Let's assume that later in the government report you find data on the outcome of surgery broken down by the condition of the patient before the operation.
Patients are classified as in either poor or good condition. Let’s say you learn the following:
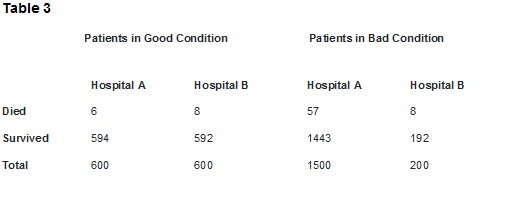
- Hospital A beats Hospital B in patients in good condition: only 1% (6/600) died in Hospital A, compared with 1.3% (8/600) in Hospital B.
- Hospital A wins again for patients in poor condition, losing 3.8% (57/1500) to Hospital B's 4% (8/200).
Conclusion: Hospital A is safer for both patients in good condition and patients in poor condition. If you are facing surgery, you should choose Hospital A. But you would not know to select Hospital A if presented with the aggregated metric.
Let's be harshly realistic. If you are a hospital administrator seeking the full benefit of government rewards for better patient outcomes, you may be inclined to reject patients in poor condition in order to improve your aggregate patient outcome metric.
Critics of "better pay for better patient outcomes" have been quite vocal about this unintended consequence, and claim some hospitals are, indeed, sending poor condition patients elsewhere in order to maintain a desirable patient outcome result.
Another Possible Subgrouping For Studying Patient Outcomes
Patient outcomes, among many other factors, could very well be physician/surgeon-specific. It would be interesting to see a breakdown of outcomes by, say, the surgeons performing a specific type of procedure.
There's an old statistical joke relating to this. Probability is measured by the relative frequency of an event in the long run.
It does not mean what the hypothetical physician thought it meant, when she said: "I'm sorry to say you have a very serious disease. As a matter of fact, 9 out of every 10 people who have this disease die of it. But you are very lucky you came to me. You see, the last 9 people I examined/treated who had the disease, died."


